Handling lots of numbers can be tough. It’s much easier to see these numbers in charts or graphs.
This is where OCR, comes in handy. It changes boring lists of numbers into clear visuals. It makes information from non-editable PDF formats into editable ones.
In this blog, we will look at how OCR data visualization works, give some examples, and talk about its good and bad points.
By turning data into graphs and charts, professionals can extract important insights and make smarter decisions faster. Let’s check out how OCR helps with understanding data better.
Make your accounting and bookkeeping practice more efficient: Download this eBook today!
What is OCR data visualization?
OCR data visualization takes numbers and facts from PDFs and turns them into charts, graphs, and maps to extract essential insights from the data.
Extracting data from PDFs manually is slow and can lead to mistakes, but OCR technology speeds things up and makes it accurate.
Whether for work, school or just getting a clearer picture, this method helps make sense of lots of data quickly. It’s a fast, error-free way to see information in a form that’s simple to grasp.
Some advanced OCR uses AI technology for visualization. However, there are still many faulty errors with imagery and AI in synergy.
If you want to know more about the difference between AI and OCR, visit this blog: OCR vs AI: 7 Differences, Pros, Cons, & Which to Choose
What Are the Advantages of OCR Data Visualization?
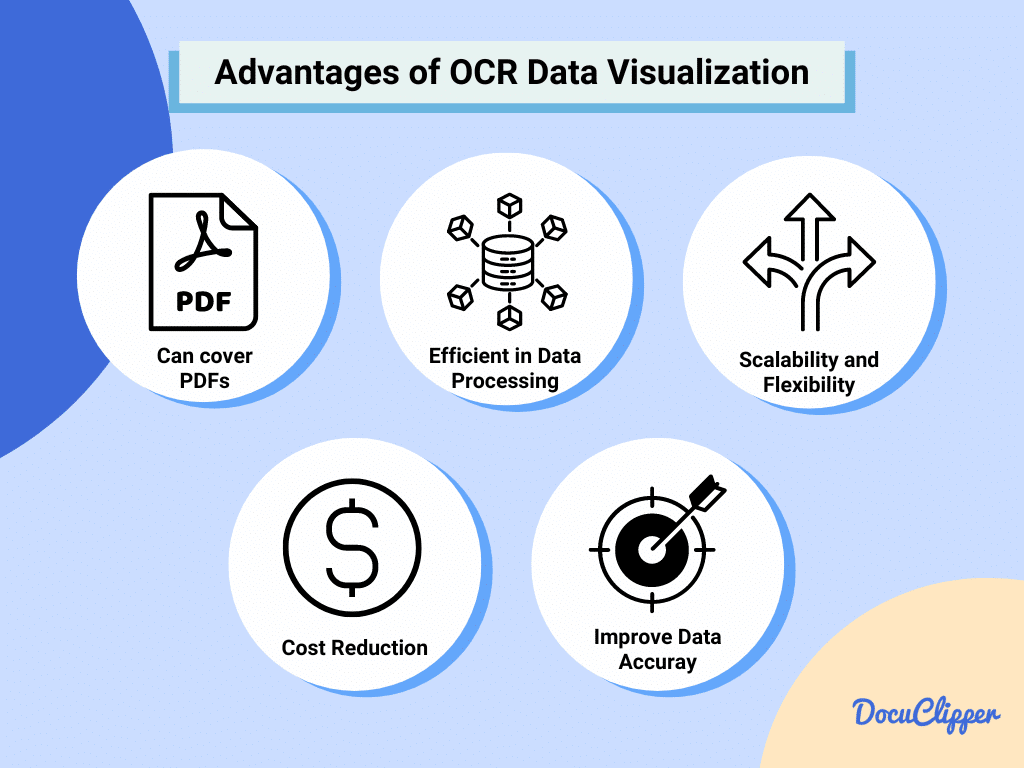
There are many advantages to doing OCR data visualization. Here are some advantages that you can get in visualizing data using OCR:
- Visualized Data That is Locked in PDFs: Instead of manually typing data from PDFs, OCR visualization tools instantly convert numbers into visuals. This process enables quick transition from raw data to interpretable charts or graphs, enhancing understanding and decision-making without the bottleneck of manual data entry. In bookkeeping data entry, this will help present clients with a limited understanding of finances in mundane formats.
- Efficiency in Data Processing: OCR technology accelerates the data processing workflow. It can transform large volumes of text into actionable insights rapidly. This efficiency means projects that once took hours or days can now be completed in minutes or seconds.
- Scalability and Flexibility: With OCR, adapting to increasing volumes of data or changing data types is straightforward. Whether dealing with a few documents or thousands, OCR systems can scale to meet demand without losing performance. This adaptability ensures that businesses of all sizes can leverage OCR for their data visualization needs.
- Cost Reduction: Traditional data entry not only demands a workforce but also incurs significant costs in salaries and operational expenses. OCR solutions, often available for a monthly subscription fee of less than $200, present a cost-effective alternative. By automating data entry using OCR, businesses can reallocate resources to more strategic areas.
- Improved Data Accuracy and Reliability: Advanced software has high levels of precision in OCR data extraction, minimizing errors associated with manual data entry. This accuracy is critical for reliable data analysis and visualization, ensuring that decisions are made on a solid data foundation. Improved data quality directly impacts the clarity and usefulness of visualized information, leading to better outcomes.
What Are the Disadvantages of OCR Data Visualization?
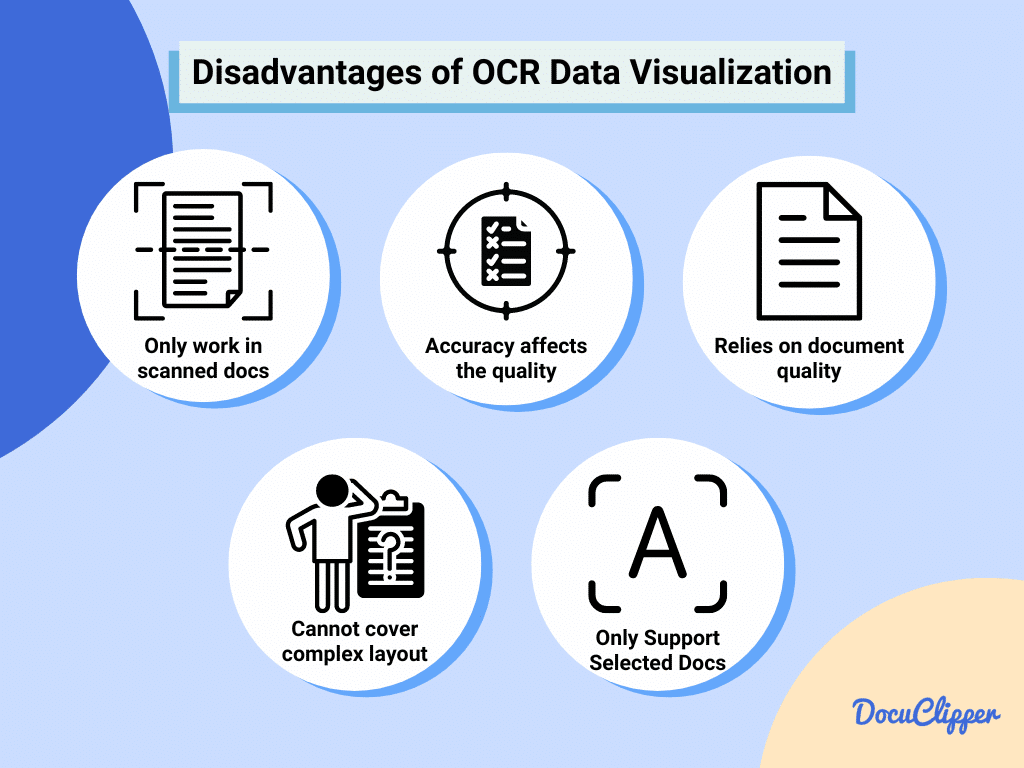
It may not look like it but using OCR data visualization has its cons, here are some disadvantages that it has in visualizing data:
- Only Works from Scanned Documents: OCR technology works primarily with scanned documents, such as images in PNG, JPG, or PDF formats. The effectiveness of OCR data capture depends on the file type, and not all formats are equally supported, which can limit its application.
- The OCR accuracy can affect the quality of data: The accuracy of OCR tools varies widely. Some OCR solutions excel in specific niches but may perform poorly in others. This inconsistency can impact the quality of data visualization, as inaccuracies in data extraction lead to misleading or incorrect visuals.
- Depends on the Document’s Quality: The clarity of the original document significantly influences OCR accuracy. Blurry or low-quality scans can result in errors or misinterpretations by the OCR software, compromising the reliability of the data and, consequently, the visualizations.
- Limitations in Recognizing Complex Patterns & Layouts: OCR technology has limitations in recognizing and processing complex patterns, layouts, and formats. For example, software designed for bank statements might need to accurately process other types of documents. Additionally, the language or unique formatting within documents can pose challenges. If you want to know more about OCR bank statement technology, visit this article: What is OCR Bank Statement Technology and Why It is So Important
- OCR Software-Supported Documents: Not all OCR solutions support the same range of document formats. This compatibility issue may necessitate additional steps, such as using file converter software, to prepare documents for OCR processing. While solutions exist, this adds complexity and potential points of failure to the data visualization process.
Examples of OCR Data Visualization
There are many examples of visualizing data using OCR, here are some common examples that businesses and professionals use:
Visualizing Cash Flow
Visualizing cash flow with OCR is like turning piles of paper bank statements and receipts into a clear, colorful chart that tells you exactly where your money is going.
Here’s how it works: OCR technology scans all your financial documents and pulls out important numbers—like how much money you made, spent, and saved. This means no more typing in numbers by hand.
For instance, let’s say the OCR tool DocuClipper scans your bank statements. It can show you, with pictures and graphs, how much money you spent last month or how your money has grown over the year. This makes it super easy to see what’s happening with your money at a glance.
So, by using pictures to show your money’s journey, businesses can quickly spot where they’re spending too much or not making enough. It’s like having a financial health check-up that helps you make smarter money decisions.
Visualizing Income/Expense Report
Understanding the flow of your finances, like tracking the money coming in and going out can often seem complex.
However, OCR data visualization technology is changing this process. By scanning your bank statements, OCR technology extracts and analyzes your financial data, converting it into visual charts.
These visual representations allow you to see at a glance whether you’re spending more than what you’re earning, or if you’re managing to save. It’s similar to having a financial health report presented not in rows of daunting numbers, but in clear, intuitive visuals.
This means you can quickly identify areas of excessive spending or confirm that your financial planning is on the right track.
Visualizing Flow of Funds
Using OCR technology scans your financial papers and turns them into easy-to-see charts. So, if you have lots of ways you make money or spend it, these visuals make it super clear to understand what’s happening with your finances.
This is especially useful when there are many sources of income. By turning complicated numbers into simple visuals, like charts, it becomes much clearer to see what’s happening financially. It also helps people with limited knowledge of finance and accounting to understand quickly.
This method helps spot where you can save more or need to cut back, making it a handy tool for better managing money.
OCR has been used widely in automating accounting and bookkeeping as converters for financial documents for accounting software like Quickbooks. To know more, visit this article: How to Convert PDF to QBO
Conclusion
OCR data visualization stands as a powerful tool for converting data from PDFs and translating complex numerical data into digestible, visual formats.
It offers the dual advantage of efficiency and clarity, allowing for rapid data processing and easy comprehension of financial states through visuals such as charts and graphs.
While it shines in converting scanned documents into actionable insights and scales effectively with varying data volumes, challenges like dependency on document quality and limitations in recognizing complex layouts remind us of its boundaries.
Yet, its benefits in cost reduction, data accuracy, and the ability to visualize critical financial operations like cash flow, income/expenses, and fund movements underscore its value.
Through practical examples, we’ve seen how OCR visualization aids in smarter financial decision-making, offering a clearer financial narrative for businesses and individuals alike.
FAQs about OCR Data Visualization
Here are some frequently asked questions about OCR data visualization:
Where is OCR data visualization used?
OCR data visualization is used across various sectors, including finance, healthcare, education, and legal industries. Businesses leverage it to streamline financial reporting, patient record management, educational content digitization, and document automation processes.
What is the main purpose of OCR data visualization?
The primary goal of OCR data visualization is to convert text from scanned documents into editable and visually interpretable formats. This facilitates easier analysis and understanding of complex data, aiding in decision-making and reporting.
What is the purpose and use of OCR data visualization?
OCR data visualization serves to analyze vast amounts of data from scanned documents faster, more accurate, and more understandable. It’s used to transform raw data into graphical representations that are easy to comprehend, allowing users to quickly identify trends, patterns, and insights.
What are the key benefits of OCR data visualization?
The key benefits include increased efficiency and time savings by automating data entry, improved accuracy and reliability of data analysis, cost reduction by minimizing manual labor, scalability to handle large volumes of documents, and enhanced clarity in presenting complex data through visual means.
